1. Abstract
A 2.5-gallon sealed glass jar terrarium containing moss, plants, isopods, springtails, and microbes was monitored continuously for 79 days using a sensor logging CO₂, temperature, and relative humidity every 30 seconds. The system was subjected to 48 hours of continuous light followed by 48 hours of continuous darkness, with the goal of testing how a small sealed ecosystem responds to extended photoperiod stress.
Under extended light, CO₂ declined 260 ppm from 1,732 to 1,472 ppm, but the drawdown decelerated sharply, suggesting the system approached a photosynthetic floor near 1,200 ppm rather than continuing to fall. Under extended darkness, CO₂ rose 721 ppm to a peak of 2,202 ppm at hour 16 before beginning to decline; the rise rate dropped from +57.0 ppm/hr in the first 11h to −1.0 ppm/hr in the next 11h. The observed peak was 2.14× below the ~4,721 ppm peak that a linear extrapolation from baseline nighttime rates had predicted. Following treatment, CO₂ did not return to pre-treatment baseline; it overshot to a record low of 1,020 ppm and then stabilized at a new, lower equilibrium. Temperature and humidity remained tightly bounded throughout.
Beyond these treatment results, the experiment also revealed dual stable equilibria in the pre-treatment phase, with the system locking into a high-CO₂ regime (~3,443 ppm) that resisted venting until decomposing organic matter was removed. Together these findings suggest small sealed ecosystems may be more resilient to photoperiod disruption than linear projections imply, with implications for sealed payload design and controlled-environment agriculture. The complete monitoring system was assembled for ~$50 in commercially available hardware, demonstrating that quantitative data of sealed ecosystems is achievable without laboratory infrastructure.
2. Introduction, Questions & Hypothesis
Sealed ecosystems balance two competing biological processes: photosynthesis, which consumes CO₂ and releases O₂, and respiration (microbial, plant, and invertebrate), which consumes O₂ and releases CO₂. In sealed systems these processes must equilibrate over time, and CO₂ concentration is the most accessible signal of that balance due to its continuous measurability with low-cost sensors and responsiveness on timescales from minutes (drawdown after lights-on) to weeks (shifts after intervention). How and whether a sealed ecosystem maintains this balance under disruption is a foundational question for both ecology and closed-loop environments such as space habitats.
Prior work on sealed ecosystems has focused primarily on large-scale closed-system research. It has demonstrated both the possibility and the unexpected fragility of sealed multi-organism ecosystems at scale (Severinghaus et al. 1994). By contrast, small-scale sealed terraria (mason-jar ecosystems, sealed vivaria of ~1–10 L containing substrate, plants, and insects) have been a hobbyist practice for decades, but are rarely quantitatively characterized: the available record is dominated by qualitative description rather than continuous measurement. There is a gap between what is known about ecological systems at the human-occupied scale and what is known at the tabletop scale, and this experiment was designed in the hopes of filling some of said gap.
One of the primary sources of inspiration for this work comes from sealed lunar payloads such as Lunaria One's ALEPH-1 mission, which plans to deliver sealed plant-bearing chambers to the lunar surface and observe their behavior over a 72-hour post-landing window. Whether small sealed Earth ecosystems can tolerate dramatically extended photoperiods, and how their CO₂ dynamics change under such conditions, has direct relevance for the design of payloads in extraterrestrial environments where Earth-evolved circadian assumptions do not hold.
Plant responses to extended light/dark cycles have been studied in agricultural contexts and shown to depend strongly on the length of the imposed cycle, with effects on growth, pigment content, and stress response varying by species (Shibaeva et al. 2024). The behavior of plants embedded in a sealed multi-organism system under such cycles, however, has not previously been characterized.
The study is conducted at hobbyist scale and budget, partially as an experimental subject and partially as a test of whether such systems can be characterized rigorously without institutional infrastructure. The primary questions of this study are:
- Equilibrium behavior. What CO₂ equilibrium does a small semi-sealed terrarium establish under a 16h light / 8h dark cycle, and is this equilibrium stable across multi-day windows?
- Photoperiod stress response. How do a sealed terrarium's CO₂ levels respond to a 48h continuous-light / 48h continuous-dark treatment?
- Recovery and resilience. Following the 48h treatment, does the system return to its pre-treatment equilibrium, settle into a new regime, or fail to recover?
Quantitative predictions made before treatment: based on a measured baseline nighttime CO₂ rise rate of +67.5 ppm/hr, a linear extrapolation projected CO₂ would reach approximately 4,721 ppm after 48h of darkness. Following the dark phase, CO₂ was predicted to return to the pre-treatment baseline (~1,570 ppm) within 7–14 days under the resumed 16h / 8h cycle. The overall hypothesis was that the sealed system would demonstrate resilience: that it would survive both treatment phases without crossing the abort threshold, and that key environmental variables (CO₂, temperature, humidity) would return to their pre-disturbance patterns within the recovery window.
Known risks anticipated at the design stage included: (1) the single-trial design, which makes it difficult to know whether the result is reliable or just due to chance; (2) limited experimental hardware that does not approach laboratory-grade lighting or sensing; (3) the inability to separate microbial, plant, and invertebrate respiration in the combined CO₂ signal; and (4) the possibility that interventions during the pre-experimental stabilization period would affect results. These limitations are detailed fully in section 6.
3. Methods
3.1 Terrarium construction
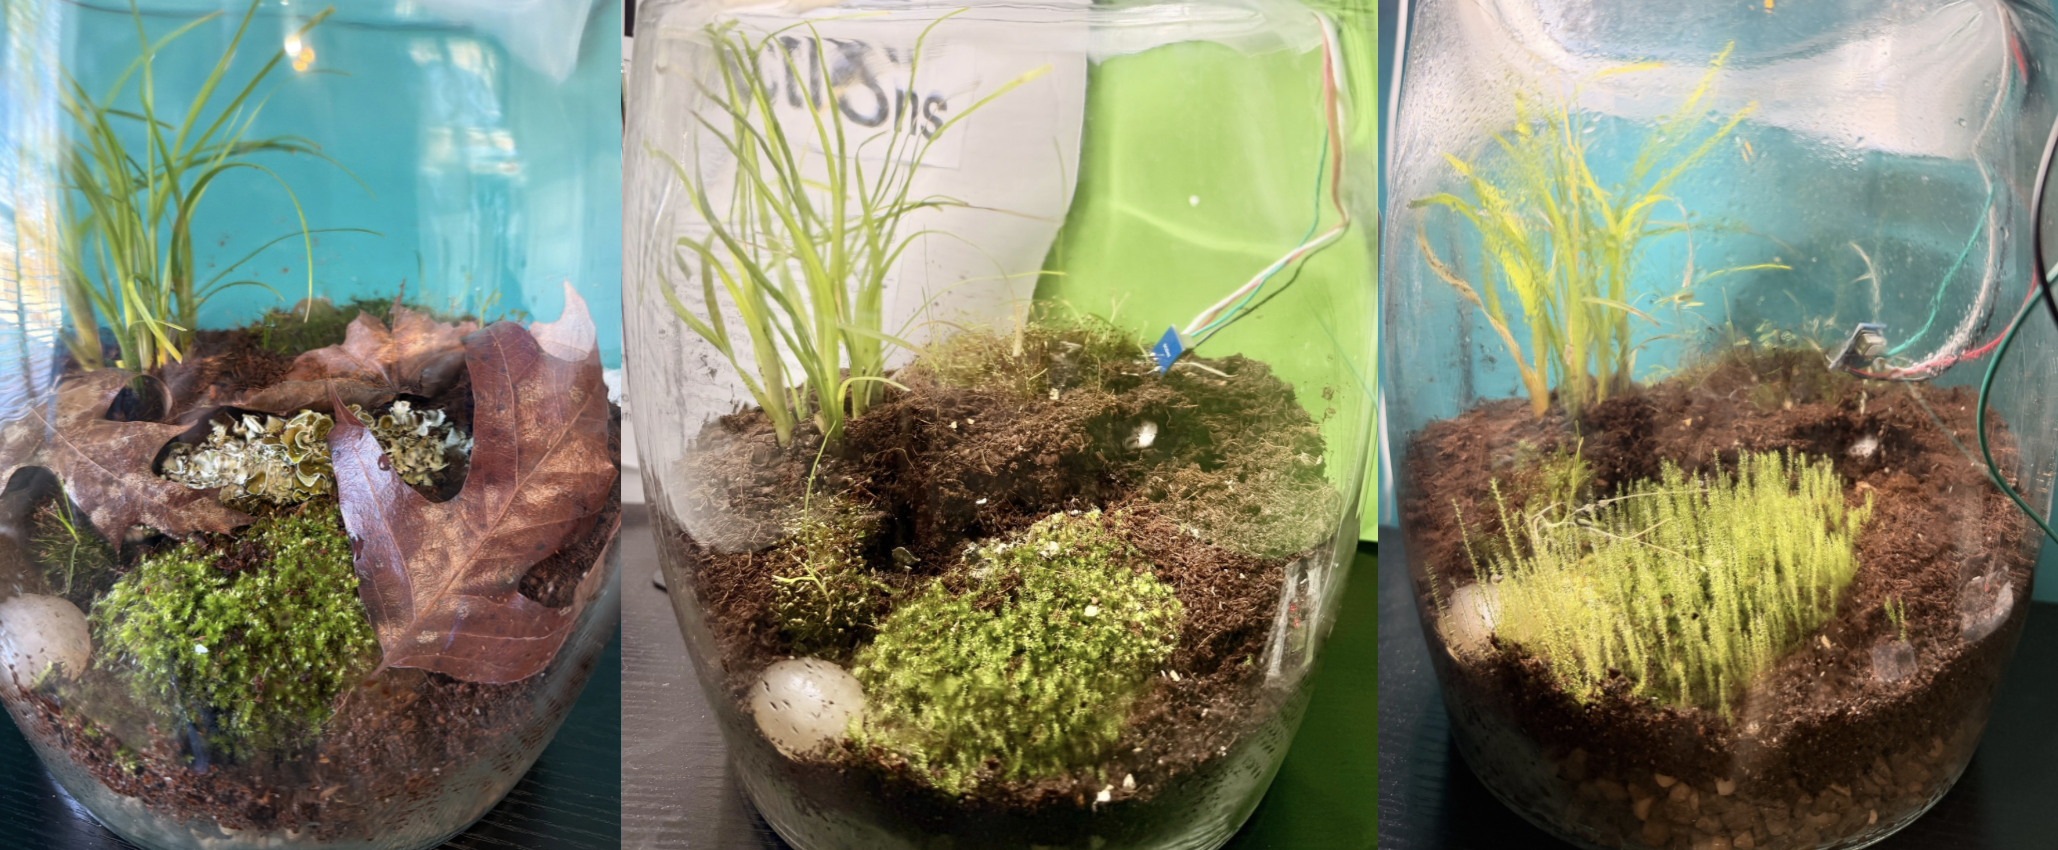
The system consisted of a 2.5-gallon glass jar sealed with a glass lid that rested on a silicone rim, producing a firm but not gas-tight seal. The substrate was a mixture of coco fiber, topsoil, and sand (roughly 3:2:1, respectively), with a depth of ~1.5 inches, resting on top of a layer of aquarium gravel for optimal drainage.
Inhabitants included a population of 4 isopods (Porcellio pruinosus), a colony of unknown size of temperate springtails (Folsomia candida), locally sourced moss, and an unidentified grass-like plant (Figure 1).
3.2 Monitoring hardware
CO₂, temperature, and relative humidity were recorded continuously using a Sensirion SCD41 sensor connected to an ESP32 microcontroller, with new readings logged every 30 seconds. The sensor was suspended 1 inch above the substrate line towards the middle of the jar. Over the 79-day experimental window (Feb 8 – Apr 28, 2026), this yielded ~184,000 readings. Data were streamed to a live dashboard for remote monitoring.
Total hardware cost was approximately $50, and all components are commercially available without institutional purchase channels.
3.3 Lighting
Light was provided by a Kullsinss full-spectrum LED halo grow light (model B0BZ88W8C2) positioned roughly 2 inches above the jar. The fixture contained 48 LEDs spanning 380–760 nm and was set to the 6,000 K white mode at maximum brightness (level 10 of 10). The manufacturer does not publish wattage, PPFD, or lumen output; the absence of calibrated light-intensity measurements is noted as a limitation.
The grow light's onboard controller offered only three cycles (3h, 9h, 12h), none of which matched the intended schedule. Light timing was therefore controlled externally: the grow light's power button was held down mechanically with a clothespin, and the unit was plugged into a programmable smart plug.
3.4 Experimental phases and timeline
Continuous monitoring began on Feb 8, 2026. The sealed system initially equilibrated at approximately 4,700 ppm CO₂. On Mar 11, a decomposing lichen-covered stick and the majority of the leaf litter were removed from the jar, and the light cycle was simultaneously changed from 12h to 16h. Over the following two weeks CO₂ transitioned to a lower regime, after which the experimental phases described below were run.
Control baseline (Phase 2): Mar 26 – Apr 2 (7 calendar days) under a 16h light / 8h dark cycle with no further intervention.
48h continuous light (Phase 3a): Apr 3, 10:00 AM – Apr 5, 10:00 AM. The light was kept on for the full 48h. An abort threshold of 5,000 ppm CO₂ was set in advance, at which point the treatment would have been terminated.
48h continuous dark (Phase 3b): Apr 5, 10:00 AM – Apr 7, 10:00 AM. The light was turned off for the full 48h.
Recovery (Phase 4): Beginning Apr 7, the 16h / 8h cycle was reinstated, and monitoring continued through Apr 28.
3.5 Data processing
Data were processed in Python (pandas), with scripting assistance from Claude Code. Readings outside physically plausible ranges were flagged as sensor glitches and excluded: CO₂ below 300 ppm or above 10,000 ppm, temperature below 10 °C or above 40 °C, and relative humidity below 50% or above 100%. This removed 12 CO₂ readings (0.007%), 18 temperature readings (0.010%), and 41 humidity readings (0.022%). The effect on phase averages was less than 1 ppm CO₂, 0.1 °C, and 0.1% RH.
Any interval exceeding three hours without a sensor reading was classified as a data gap. Two such gaps occurred during the reporting window: Mar 30 – Apr 1 (40.5h, during the control baseline) and Apr 6 – Apr 7 (29.5h, spanning the dark-to-recovery transition).
CO₂ drawdown rates were calculated by taking the mean of readings within 10 minutes imminently following lights-on (8:00 AM) and subtracting the mean of readings within 10 minutes of 10:00 AM, then dividing by two hours to yield ppm/hr. Rise rates were calculated identically across the midnight lights-off transition. Daily amplitude was defined as the difference between mean CO₂ during dark hours (midnight – 8:00 AM) and mean CO₂ during light hours (8:00 AM – midnight).
4. Results
4.1 Pre-Experiment Period (Feb 8 – Mar 25)
CO₂ rose from ~500 to ~4,527 ppm in the two days following the initial lid sealing and watering on Feb 24. The system equilibrated at this plateau through Mar 10, with daily averages ranging from 2,641 to 4,660 ppm (excluding the Mar 7 lid-open day). Brief lid-openings on Feb 28, Mar 4, and Mar 6 each dropped CO₂ sharply (to a minimum of 400 ppm on Mar 6), but the system rebounded to the 3,000–4,400 ppm range within roughly two days each time. On Mar 11, the lichen-covered stick and the majority of the leaf litter were removed, along with a shift from a 12h/12h to a 16h/8h light cycle. CO₂ transitioned to the 1,500–1,800 ppm range over the following two weeks. The sealed system established and maintained a high-CO₂ equilibrium that resisted venting, then transitioned to a lower equilibrium following the Mar 11 intervention (Figure 2).
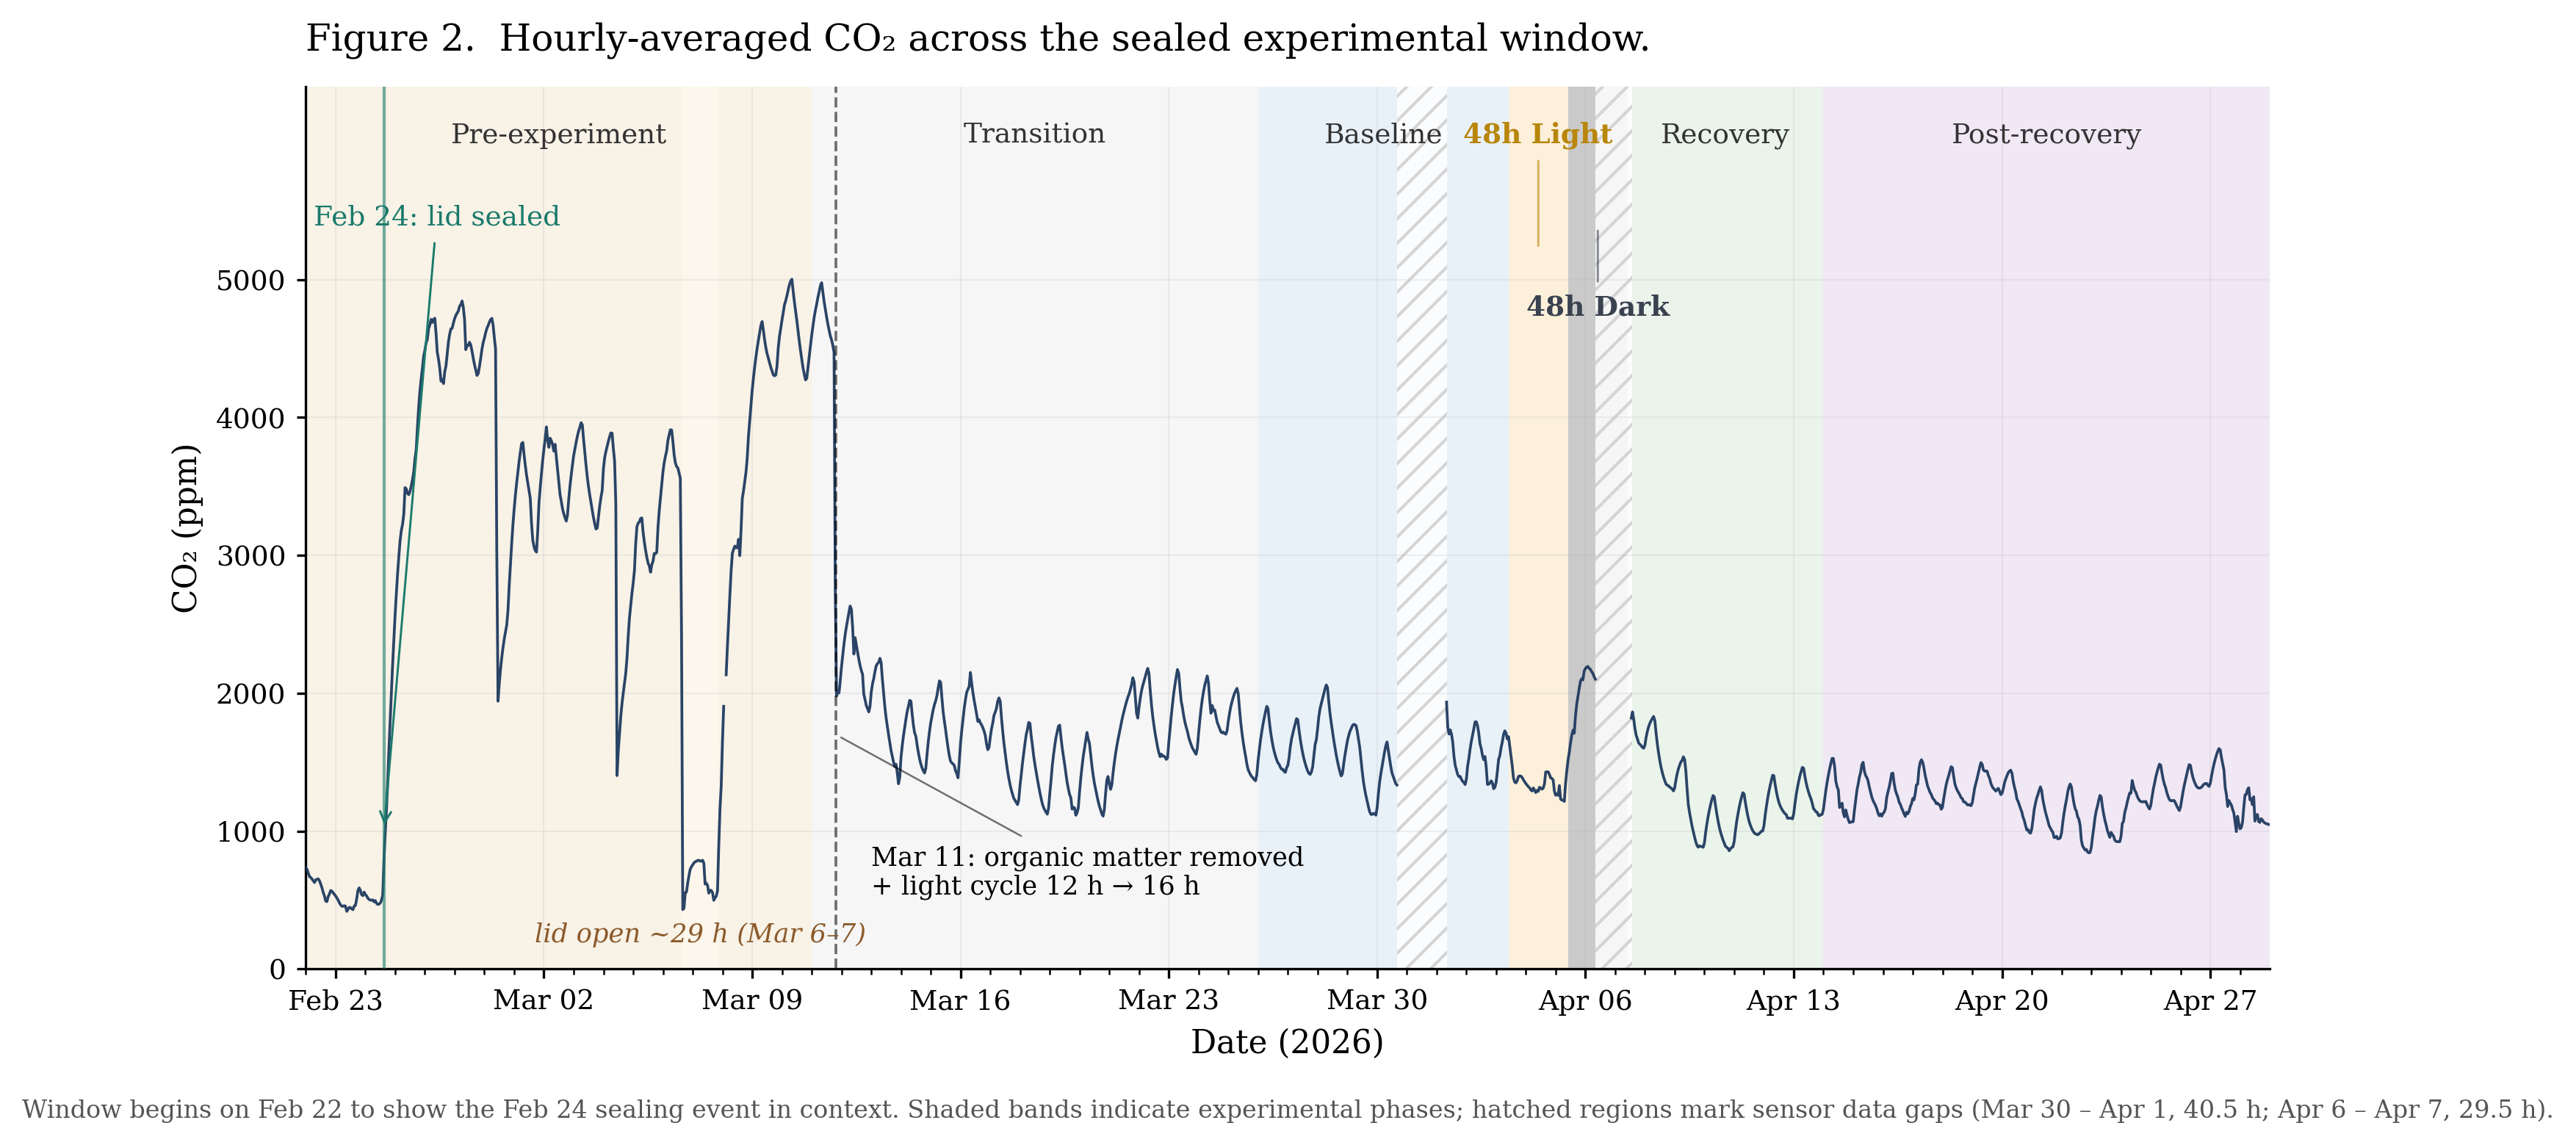
4.2 Baseline (Mar 26 – Apr 2)
Baseline data collection spanned 7 calendar days, yielding ~5–6 days of continuous data after excluding the Mar 30 – Apr 1 sensor gap. CO₂ averaged 1,570 ppm (range: 1,110–2,075 ppm). Drawdown in the first 2 hours after lights-on (8:00 AM) averaged −59.7 ppm/hr, ranging from −35 to −85 ppm/hr across individual days; rise in the first 2 hours after lights-off (midnight) averaged +67.5 ppm/hr, ranging from +31 to +94 ppm/hr. Daily CO₂ amplitude (the difference between dark-period and light-period averages) was +179 ppm, with an average daily range of 573 ppm. Temperature averaged 20.9 °C (range: 18.5–22.9 °C) and relative humidity averaged 96.4% (range: 89.1–97.6%). The baseline system was stable and predictable, with consistent day/night CO₂ swings and tight environmental conditions.
4.3 Continuous Light (Apr 3 – Apr 5)
CO₂ declined 260 ppm over the 48h continuous-light phase (1,732 → 1,472 ppm), reaching a minimum of 1,186 ppm at hour 42. The drawdown was front-loaded and decelerated sharply: −27.2 ppm/hr over the first 14h, then +7.9 ppm/hr over the last 12h. The overall average across the full 48h was −5.4 ppm/hr. Temperature averaged 22.0 °C (roughly 1 °C warmer than the control baseline) and humidity held at 96.8%. CO₂ drawdown slowed and reversed before the 48h window ended, suggesting the system approached a floor rather than continuing to fall (Figure 3).
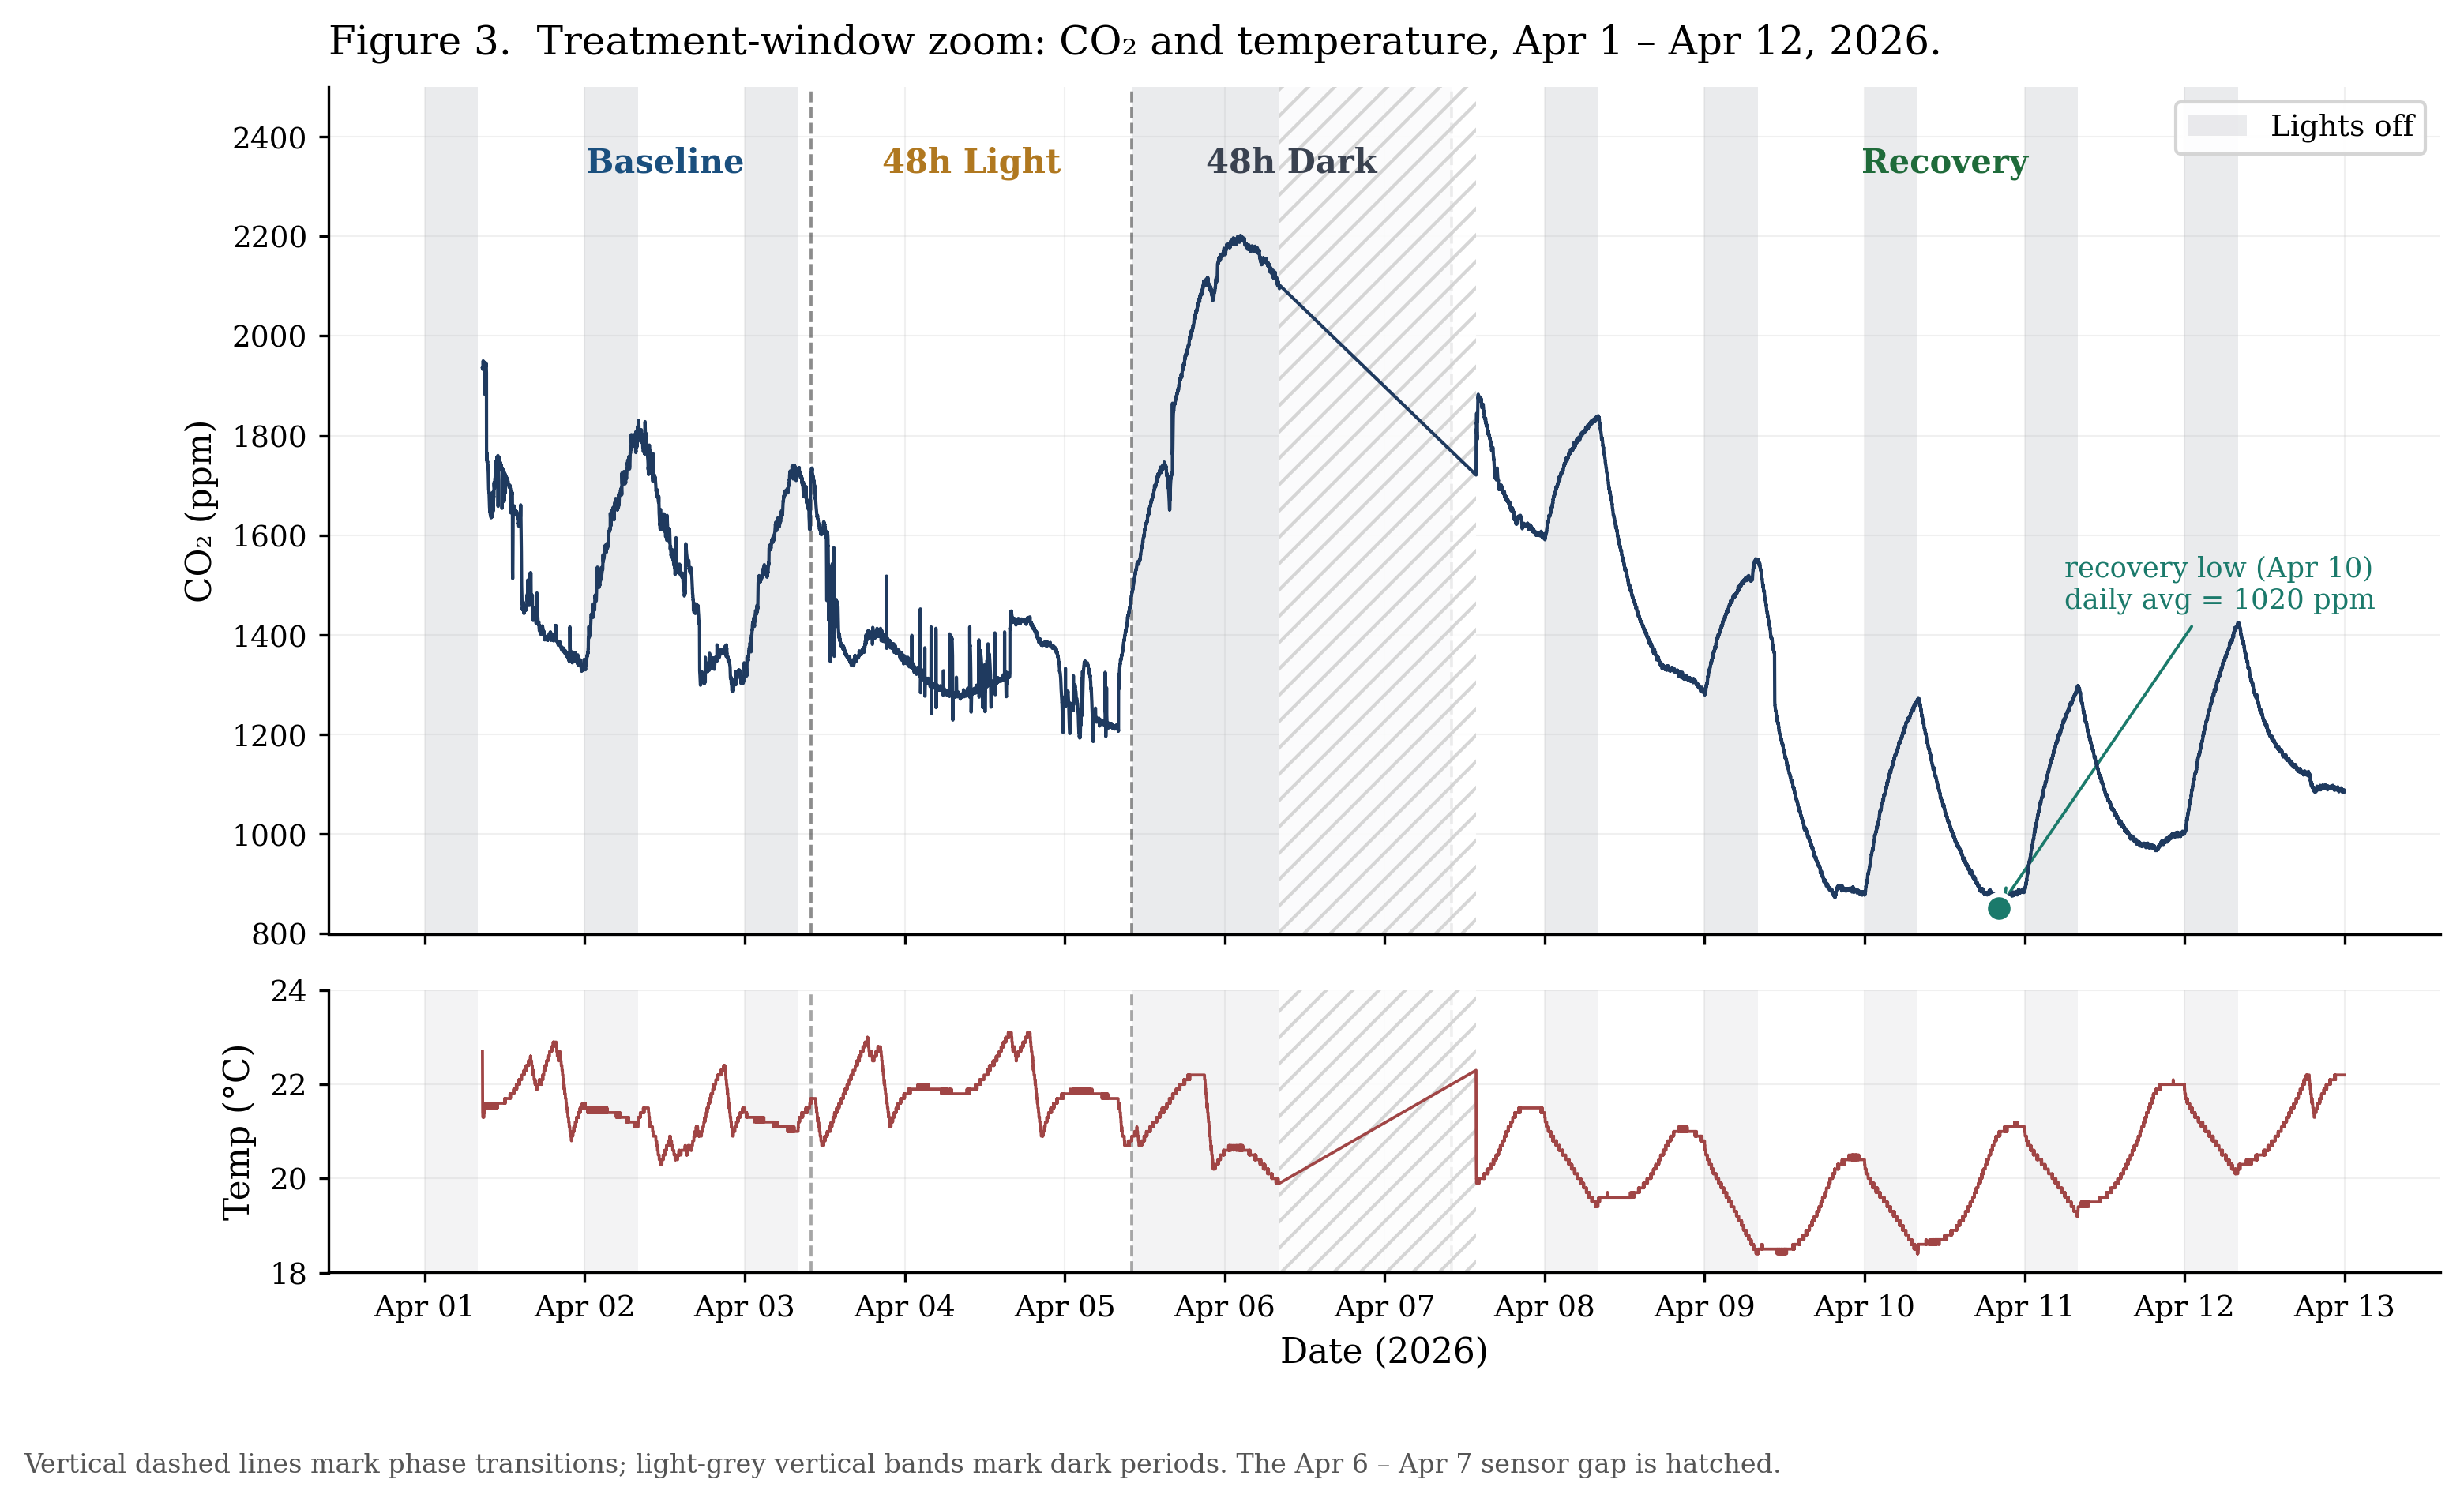
4.4 Continuous Dark (Apr 5 – Apr 7)
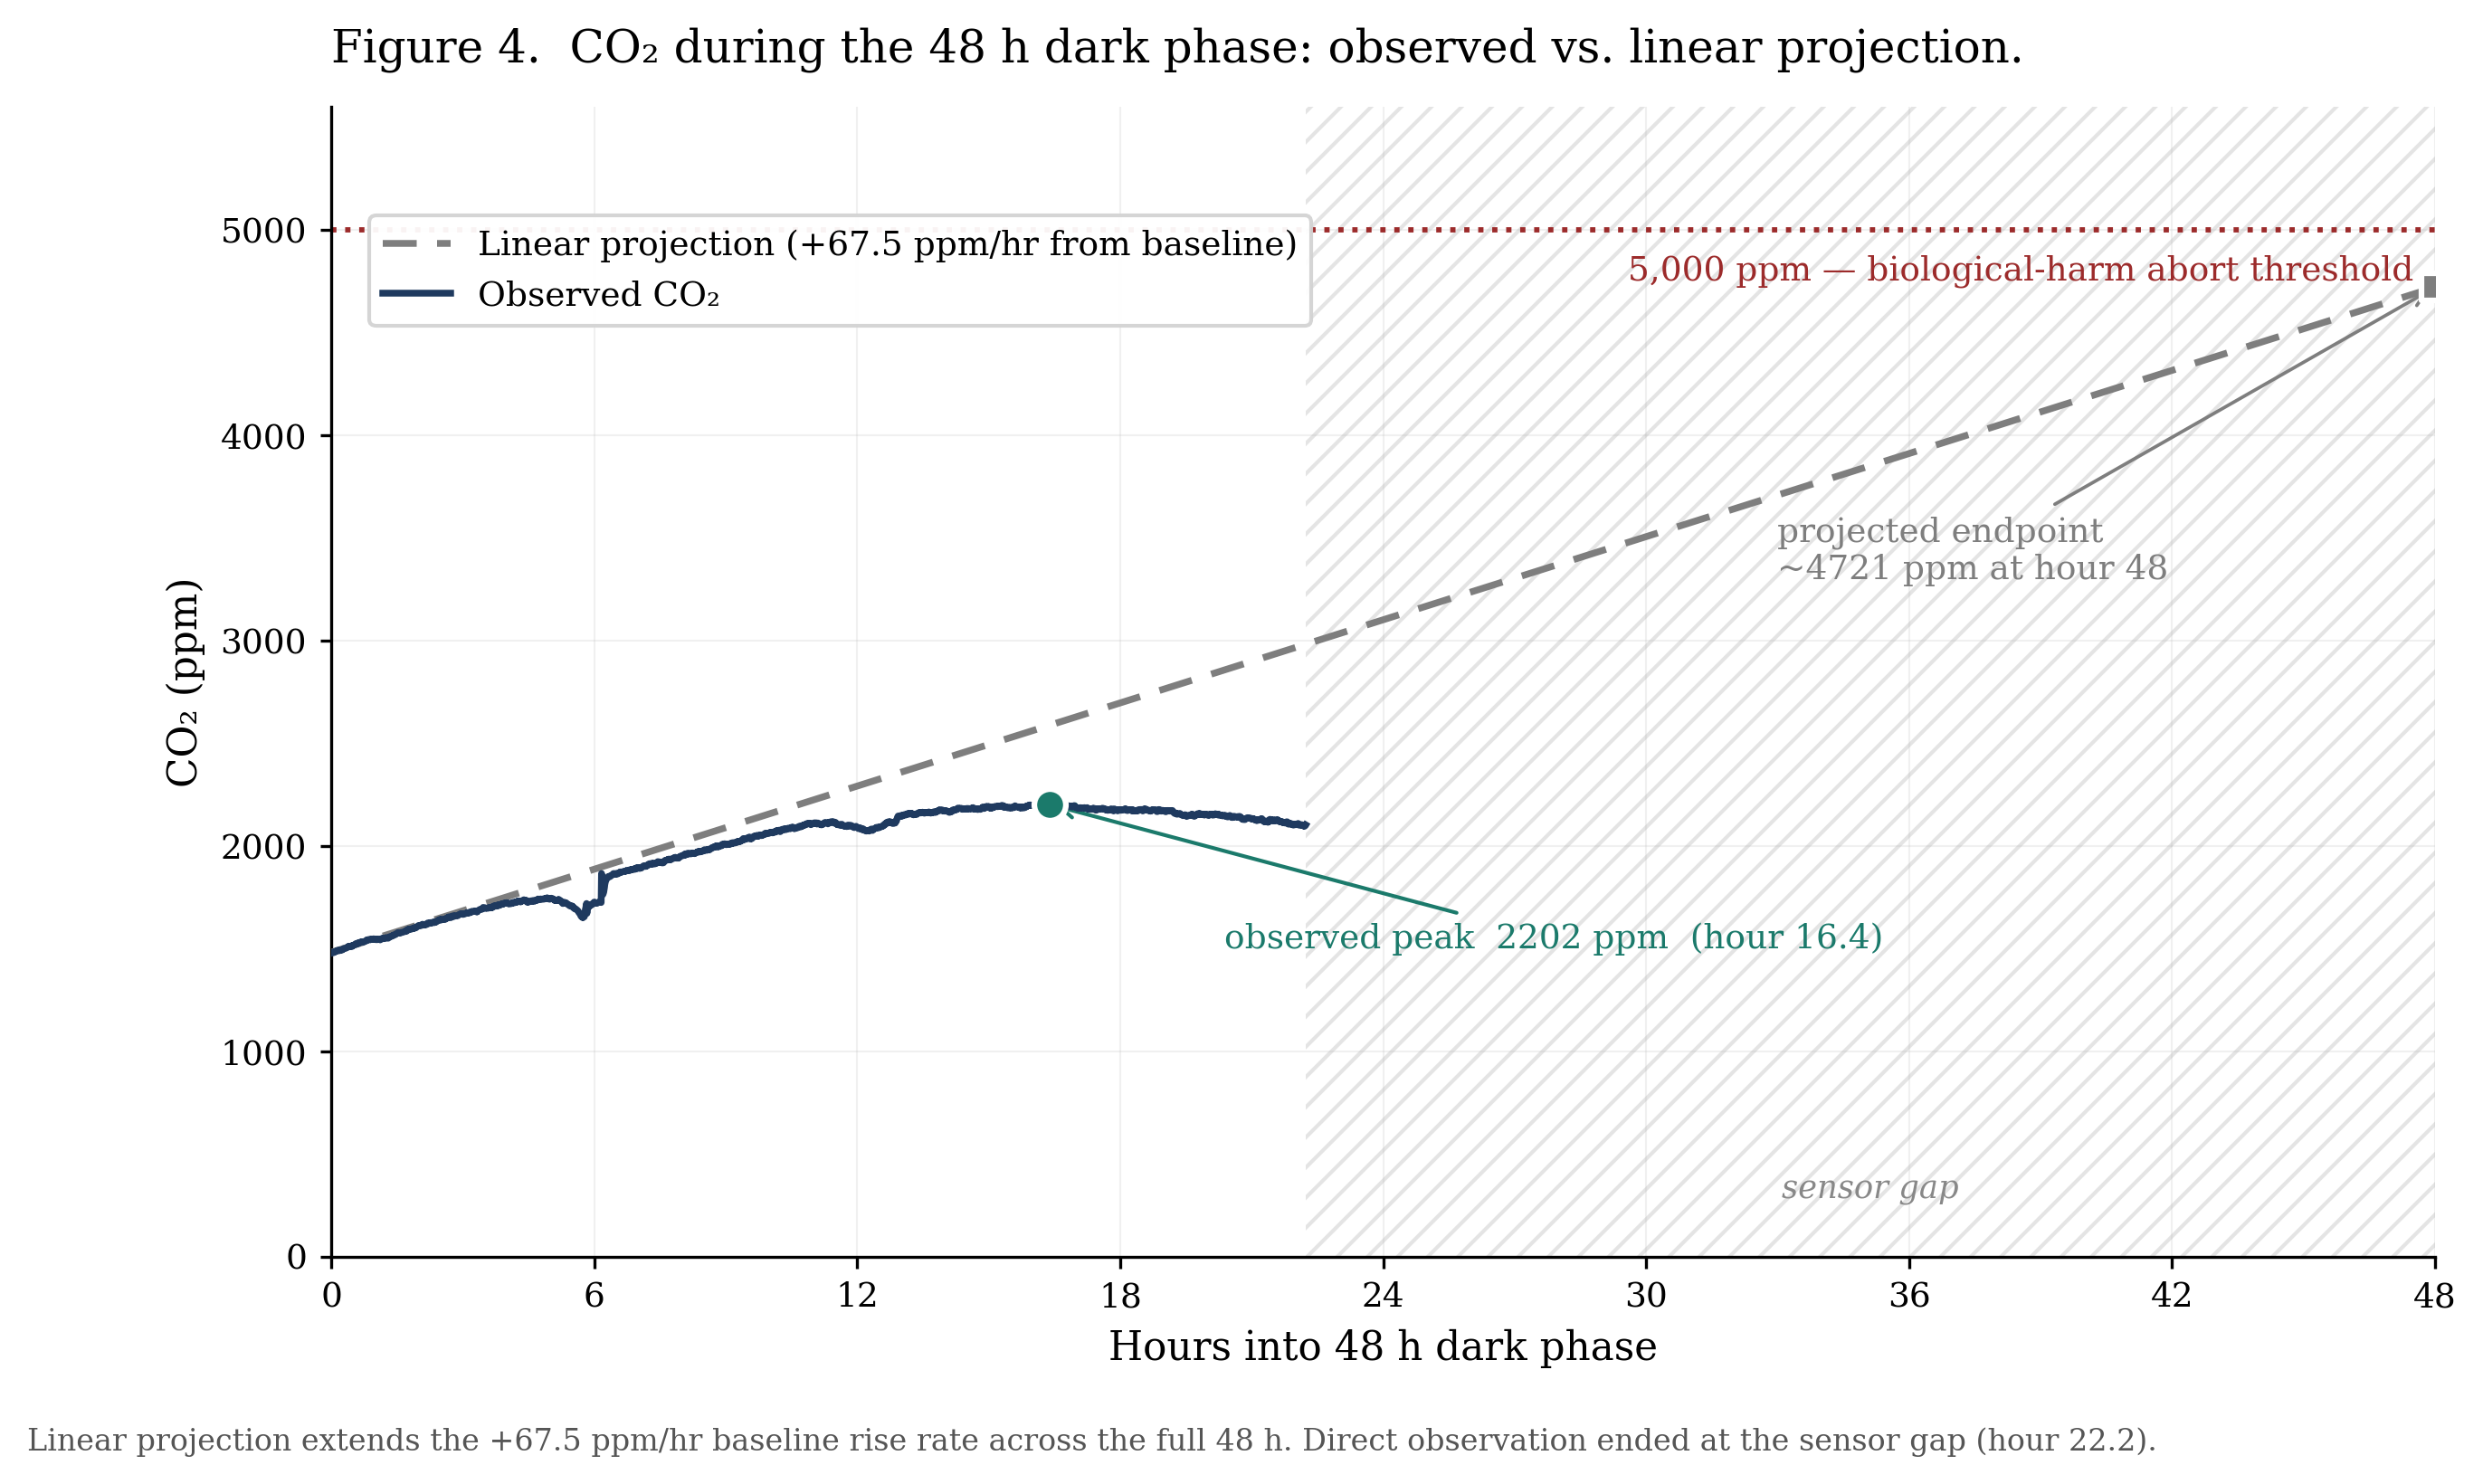
The first 22.2h of the 48h dark phase saw CO₂ climb from 1,481 ppm to a peak of 2,202 ppm at hour 16 (a rise of 721 ppm), before beginning to decline to 2,099 ppm by the start of the sensor gap at hour 22.2. The rise was front-loaded and decelerated dramatically: +57.0 ppm/hr over the first 11h, then −1.0 ppm/hr over the next 11h. The overall average of +27.8 ppm/hr was well below the +67.5 ppm/hr measured during normal 8h dark periods in the control phase. A linear extrapolation from that baseline rate had predicted CO₂ would reach approximately 4,721 ppm by the end of 48h of darkness; the actual peak was 2.14× lower. Temperature averaged 21.0 °C and humidity held at 96.8%. CO₂ rose far more slowly than baseline rates predicted and was already declining before the dark phase ended (Figure 4).
4.5 Recovery (Apr 7 – Apr 14)
Recovery did not return CO₂ to the 1,570 ppm control baseline. Instead, the daily average dropped from 1,690 ppm on day 1 to a record low of 1,020 ppm on Apr 10, three days into recovery, and the lowest sustained level observed since the terrarium was sealed. Daily averages then began climbing: 1,075 (Apr 11), 1,201 (Apr 12), 1,255 (Apr 13). Day/night dynamics returned to near-baseline form: drawdown averaged −61.2 ppm/hr in the first 2 hours after lights-on (vs. −59.7 ppm/hr control), rise averaged +63.3 ppm/hr after lights-off (vs. +67.5 ppm/hr control), and daily amplitude was +180 ppm (vs. +179 ppm control). Temperature averaged 20.4 °C (roughly 0.5 °C cooler than the control phase) and humidity averaged 96.4%. Overall, the system overshot the baseline, dropping to a record low, while day/night dynamics returned to near-control form (Figure 3).
4.6 Post-Recovery (Apr 14 – Apr 28)
Over the 14 days following recovery, daily averages oscillated between 1,039 and 1,359 ppm with an overall mean of 1,236 ppm, roughly 334 ppm (21%) below the 1,570 ppm control baseline. A second daily-average minimum of 1,039 ppm occurred on Apr 23, followed by a rebound. Daily amplitude compressed to +87 ppm, a 51% reduction from the control's +179 ppm. Temperature averaged 21.5 °C and humidity averaged 96.8%. CO₂ did not return to the pre-treatment baseline; it stabilized at a lower level with a markedly compressed day/night swing.
5. Discussion
5.1 Alternative Stable States (Dual Equilibrium)
Alternative stable states (the phenomenon of a system maintaining different equilibria under similar conditions) are documented in ecology at scales ranging from shallow lakes to grasslands (Scheffer et al. 2001). The two equilibria observed here are consistent with that pattern, but at a much smaller scale: CO₂ averaged 3,443 ppm during the pre-experimental plateau (Feb 25 – Mar 10) and 1,570 ppm during the control baseline three weeks later, with no return to the higher level over the 49 days of post-intervention monitoring.
The lid-opening events of Feb 28, Mar 4, and Mar 6 isolate venting as a single variable. Each opening dropped CO₂ sharply, but the system rebounded to the 3,000–4,400 ppm range within roughly two days. On the other hand, the Mar 11 intervention, which bundled two changes (removal of the lichen-covered stick and leaf litter, alongside a shift from a 12h to a 16h light cycle), resulted in a new and lower equilibrium. The most likely explanation, given the venting results, is that decomposable organic matter inside the jar continued to fuel microbial respiration after each lid-opening, allowing CO₂ to climb back to its prior range; removing that material removed the fuel. A parallel mechanism was identified at much larger scale in Biosphere 2, where excess organic matter incorporated into the soil drove sustained microbial respiration that depleted atmospheric oxygen over the first 16 months of closure (Severinghaus et al. 1994).
This suggests that initial composition (particularly the quantity and decomposition rate of included organic matter) sets the achievable steady state more reliably than corrective interventions like venting can later restore. The ecosystem's possible equilibria appear to be constrained by what is sealed in at construction.
5.2 Respiration Slowing Under Extended Darkness
A linear extrapolation from baseline nighttime rates predicted CO₂ would reach approximately 4,721 ppm by the end of 48h of darkness. The observed peak was 2,202 ppm at hour 16 (2.14× below the projection) after which CO₂ declined for the remaining ~6h of observable data before the sensor gap.
One possible explanation for this is substrate limitation: as the night continued, the microbes ran low on decomposable material, slowing respiration and limiting the CO₂ rise.
Alternatively, as the microbes raised the CO₂, the higher levels could have surpassed microbe respiration resulting in less microbial activity.
A third possibility is reduced metabolic activity from the resident isopods and springtails under extended darkness. Many invertebrates exhibit lower activity in the absence of a circadian light cycle, which would reduce their contribution to total CO₂.
Temperature also dropped slightly during the dark phase (mean 21.0 °C vs. 22.0 °C during the preceding light phase), which would in principle reduce respiration rates. However, a 1 °C reduction is too small to account for the observed deceleration: values for soil microbial communities typically imply a 5–10% rate change per °C, far below the ~102% rate change observed. Temperature can be set aside as a contributing but not dominant factor.
More broadly, the gap between the linear projection and the observed peak illustrates a general issue in biological systems: short-window rate measurements often do not transfer to long-window outcomes, because factors such as substrate depletion, end-product inhibition, and behavioral shifts accumulate as the window extends. Linear trends should therefore be treated as a worst-case bound rather than a likely outcome when planning sealed-ecosystem treatments.
5.3 Recovery Overshoot & Possible Equilibrium Shift
The post-treatment system did not return to the control baseline of 1,570 ppm. Daily averages oscillated between 1,020 and 1,359 ppm over the 21 days following treatment, with a second minimum of 1,039 ppm on Apr 23, 16 days after the treatment ended. The presence of a late dip rather than a steady climb back is more consistent with a shift to a new, lower equilibrium than with a slow return to baseline. Several factors could account for a sustained downward shift:
- Photosynthetic priming. The 48h continuous-light phase may have driven plants to upregulate activity or expand effective chloroplast capacity in the short term, increasing per-photon carbon fixation. If priming alone is responsible, the effect should decay back toward baseline over weeks as the plants return to standard levels.
- Plant acclimation. The plants may have acclimated to the higher cumulative light input received during Phase 3a (for example through increased leaf area) with the resulting structural change carrying forward indefinitely. Acclimation predicts a persistent shift, in contrast to priming.
- Microbial suppression. The extended light phase exposed surface microbial communities to atypical conditions (no daily dark recovery), and the extended dark phase exposed them to substrate limitation as CO₂ plateaued; either or both may have suppressed microbial biomass that has not yet recovered.
These mechanisms are distinguishable in principle by the time course of the post-recovery system: priming alone predicts a slow return to the 1,570 ppm baseline over weeks to months; plant acclimation and microbial suppression both predict a persistent shift. Continued monitoring beyond the reporting window of this paper will allow these to be separated.
6. Limitations
Several limitations affect how strongly the conclusions of this experiment can be drawn.
Two limitations stem from the experimental design itself. First, this was a single trial: the 2,202 ppm dark-phase peak, the 1,020 ppm post-treatment minimum, and the +87 ppm post-recovery amplitude each rest on one observation, and establishing confidence around any of these values would require repeated 48h light/dark treatment cycles.
Second, the Mar 11 intervention bundled two changes (removal of the lichen-covered stick and leaf litter, and a shift from a 12h to a 16h light cycle) applied simultaneously. The resulting equilibrium shift cannot be attributed to either factor in isolation; disentangling them would require independent treatments varying organic-matter content and photoperiod separately.
There are also limiting factors about what the data can and cannot reveal. Several variables were not measured, including total light intensity, the springtail population, the bacterial/fungal community, and oxygen concentration. In addition, the CO₂ signal combines microbial, plant, and invertebrate respiration, and these sources cannot be separated within this dataset. Together, these gaps make it difficult to attribute observed changes to any single biological process.
Two sensor interruptions occurred during the reporting window. Conclusions about both events therefore rely on estimates across the gap rather than direct observation.
Finally, hardware and environmental conditions were not tightly controlled. The lighting setup (a clothespin-clamped grow light on a smart plug) is not laboratory-grade: light intensity, spectral composition, and the precision of on/off transitions are all uncertified, limiting reproducibility outside this specific configuration. Room temperature also varied modestly across phases, with a ~1.5 °C span. This difference is small relative to typical respiratory sensitivity (5–10% rate change per °C) but cannot be ruled out as a contributor to between-phase differences in CO₂ dynamics.
7. Broader Relevance
For hobbyist and citizen science, this experiment demonstrates that quantitative monitoring of sealed ecosystems is accessible without laboratory infrastructure. Approximately $50 in hardware (Sensirion SCD41 + ESP32, smart plug, grow light) produced ~184,000 readings over 79 days, a methodological template that any interested hobbyist can replicate.
For sealed lunar payloads, the results suggest greater margin than worst-case extrapolation implies. Linear projections from short-window respiration rates substantially overestimated the dark-phase peak, and the system converged on a new equilibrium rather than collapsing after treatment. The direction of the result is encouraging for sealed plant-bearing payloads.
For longer-duration sealed life-support systems, brief photoperiod disruptions did not destabilize the ecosystem in this trial. At larger scales other factors (volume, organism number, gas-exchange rates) would likely change the outcome, but the small-scale result is consistent with sealed systems having more buffering capacity than previously believed.
For controlled-environment agriculture, the post-treatment drop to 1,020 ppm raises the possibility that non-standard photoperiods alter plant carbon fixation. If reproducible, this could motivate light-cycle scheduling experiments in greenhouses or vertical farms.
8. Conclusions & Future Work
This experiment demonstrates that small sealed ecosystems can be quantitatively characterized at hobbyist scale, with widely-available hardware (~$50 total) and continuous monitoring. The resulting data is enough to reveal ecological dynamics that manual observation would miss, opening a door for hobbyists and citizen scientists who want to study semi-sealed closed-loop systems with meaningful rigor, without requiring laboratory infrastructure.
The specific findings of this experiment illustrate what becomes visible at this resolution. CO₂ rose to less than half of what a linear extrapolation from baseline rates predicted during the 48h dark phase (observed peak 2,202 ppm vs. projected ~4,721 ppm), and was already declining before the dark phase ended, suggesting sealed ecosystems may be approximately 2.14× more resilient to extended darkness than linear projections imply. The system also exhibited dual-equilibrium behavior across multi-week windows, and a recovery overshoot to a record low of 1,020 ppm. None of these findings would have been measurable through manual observation; all emerged from the continuous data record.
These findings carry caveats. This was a single trial, which limits confidence in any specific point estimate, and several confounds (the bundled Mar 11 intervention, the absence of laboratory-grade lighting, the inability to separate microbial from invertebrate respiration) are detailed in section 6. Robustness across replications cannot be claimed from this experiment alone.
Future work includes:
- Repeating the 48h treatment 4–5 more times to establish confidence in the deceleration patterns observed here.
- Running extended versions (72h or 96h) to observe how the system responds to longer photoperiod disruption.
- Adding a calibrated light intensity sensor to quantify light input.
- More broadly, extending the methodological template demonstrated here to other small sealed ecosystems, other organisms, and other treatments. The hardware is documented (sections 3.2 and 3.3), the analysis approach is reproducible, and the questions worth asking at this scale are abundant.
References
- Scheffer, M., S. Carpenter, J. A. Foley, C. Folke, and B. Walker. 2001. Catastrophic shifts in ecosystems. Nature 413: 591–596.
- Severinghaus, J. P., W. S. Broecker, W. F. Dempster, T. MacCallum, and M. Wahlen. 1994. Oxygen loss in Biosphere 2. Eos, Transactions of the American Geophysical Union 75(3): 33–37.
- Shibaeva, T. G., E. G. Sherudilo, E. Ikkonen, A. A. Rubaeva, I. A. Levkin, and A. F. Titov. 2024. Effects of extended light/dark cycles on Solanaceae plants. Plants 13(2): 244.